Introduction
Facebook Ads is one of the most popular digital advertising platforms, providing businesses with a powerful tool to reach their target audience. However, simply creating an ad and launching it on Facebook is not enough to achieve success. To create a successful Facebook Ads campaign, it is important to analyze a lot of metrics to make informed decisions and generate high-quality, cost-effective results. While Facebook provides built-in metrics to help with this analysis, creating custom metrics can help you better understand the data and make more informed decisions. In this blog, we will explore mastering Facebook Ads reporting: creating custom metrics & custom events for better decision-making and provide you with formulas to create custom metrics. We will also discuss how to create custom events like Attraction, Captivated, and Attached through Google Tag Manager (GTM), and how to use these custom metrics to create reports for better decision-making.
Built-in Metrics for Facebook Ads Campaigns
Facebook provides a number of built-in metrics to help businesses analyze the performance of their ads. These metrics include impressions, clicks, click-through rates (CTR), conversions, and more. By analyzing these metrics, businesses can determine the effectiveness of their ads and make adjustments to improve their campaigns. It is important to note that while these built-in metrics are helpful, they do not always provide a complete picture of ad performance. This is where custom metrics come in. By creating custom metrics, businesses can gain a deeper understanding of their ad performance and make more informed decisions about their campaigns. In the next section, we will explore how to create custom metrics and provide examples of commonly used formulas.
Read Also: Facebook Ads UTM Parameters in GA4: Importance and Custom Channel Groups
Custom Metrics for Facebook Ads Campaigns
In addition to the built-in metrics provided by Facebook, businesses can create their own custom metrics to gain a deeper understanding of ad performance. These metrics can be created by using formulas that combine existing metrics in new ways. Here are some examples of commonly used custom metrics for Facebook Ads campaigns:
Video Hook Rate
Video Hook Rate measures the percentage of people who watched at least 3 seconds of a video ad. The formula for Video Hold Rate is 3-sec video plays divided by impressions. This metric can help businesses understand how engaging their video ads are and make adjustments to improve their performance.
Video Hook Rate = 3-sec video plays ÷ Impressions
Video Hold Rate
Video Completion Rate measures the percentage of people who watched a video ad to completion. The formula for Video Completion Rate is: thru plays / 3-sec video plays. This metric can help businesses understand how well their video ads are resonating with their audience.
Video Completion Rate = thru plays ÷ 3-sec video plays
Post Reaction Rate
Post Reaction Rate measures the percentage of people who reacted to a post. The formula for Post Reaction Rate is Post Reactions divided by impressions. This metric can help businesses understand how engaging their posts are and make adjustments to improve their performance.
Post Reaction Rate = Reactions ÷ impressions
Post Comment Rate
Post Comment Rate measures the percentage of people who commented on a post. The formula for Post Comment Rate is Post Comments divided by impressions. This metric can help businesses understand how well their posts are driving engagement with their audience.
Post Comment Rate = Comments ÷ impressions
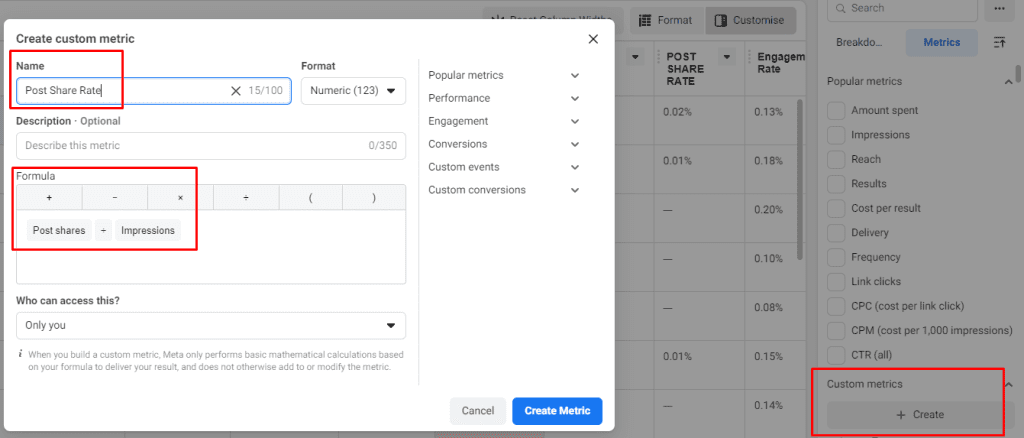
Post Share Rate
Post Share Rate measures the percentage of people who shared a post. The formula for Post Share Rate is: Post Shares divided by impressions. This metric can help businesses understand how well their posts are resonating with their audience and how much reach they are generating.
Post Share Rate = Post Shares ÷ impressions
Engagement Rate
Engagement Rate measures the overall engagement of a post. The formula for Engagement Rate is (Post Reactions + Post Comments + Post Shares + Post Saves) divided by impressions. This metric provides a comprehensive view of how well a post is performing in terms of engagement.
Engagement Rate = (Post Reactions + Post Comments + Post Shares + Post Saves) ÷ impressions
Attraction to Captivated Ratio
Attraction to Captivated Ratio measures the ratio of people who were attracted to an ad and went on to become captivated by it. The formula for Attraction to Captivated Ratio is: Captivated divided by Attraction. This metric can help businesses understand how effective their ads are in capturing the attention of their target audience.
Attraction Rate = Captivated ÷ Attraction
Captivated to Attached Ratio
Captivated to Attached Ratio measures the ratio of people who were captivated by an ad and went on to become attached to it. The formula for Captivated to Attached Ratio is: Attached divided by Captivated. This metric can help businesses understand how effective their ads are in driving conversions and achieving business goals.
Attached Rate = Attached ÷ Captivated
By creating and analyzing these custom metrics, businesses can gain a deeper understanding of their ad performance and make more informed decisions about their campaigns. In the next section, we will explore how to create custom events like Attraction, Captivated, and Attached through Google Tag Manager (GTM).
Creating Custom Events in GTM
Once you have identified the custom metrics to track and analyze, it’s time to set up custom events in GTM. Custom events are pre-defined events that Facebook uses to track various actions that users take on your website or within your app. By setting up custom events, you can track specific actions that are important for your ad campaigns, such as purchases, sign-ups, or downloads.
To create custom events for your Facebook reporting, follow these steps:
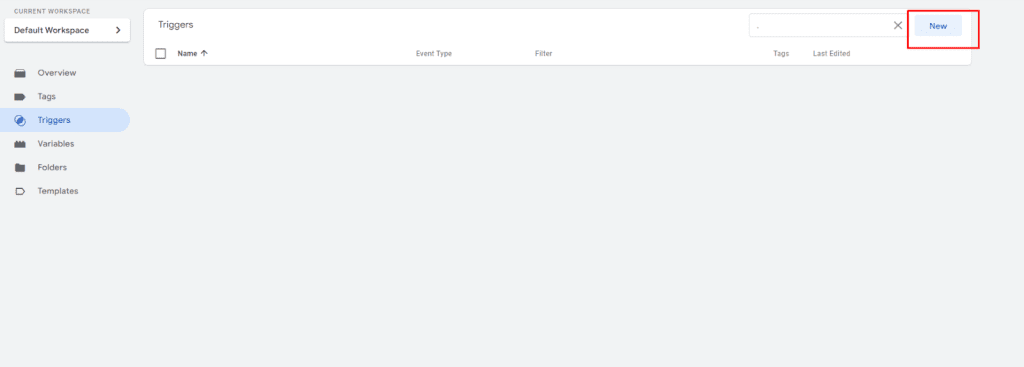
Login to your Google Tag Manager account and go to the Triggers section.
Click on “Add New” to create a new trigger.
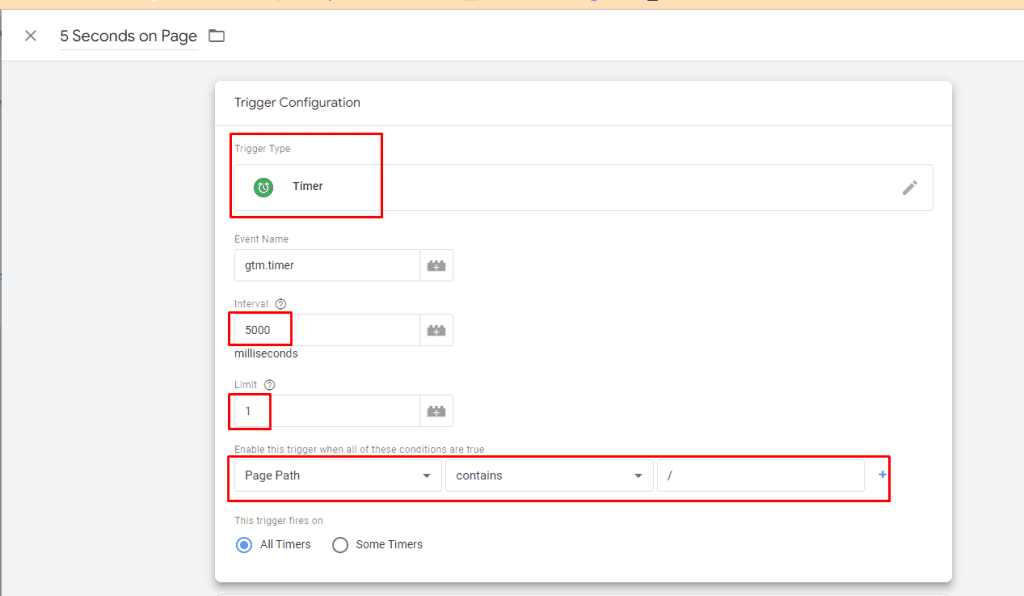
Choose the trigger type as “timer” and set the interval to 5000 milliseconds with a limit of 1. Then choose the trigger condition as the Page path contains “/”. This will be your first 5 seconds on the webpage trigger.
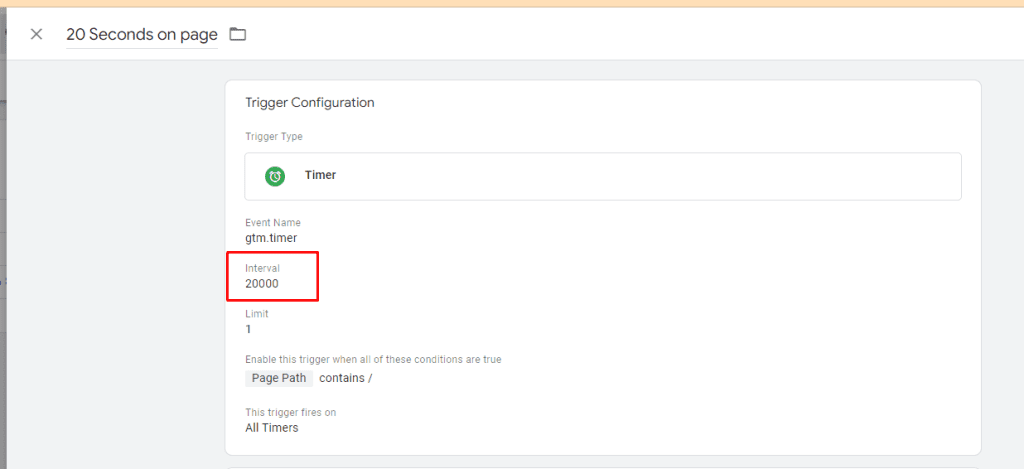
Create the second trigger which is 20 seconds on the webpage. Repeat the same process as the previous step, but set the interval to 20000 milliseconds.
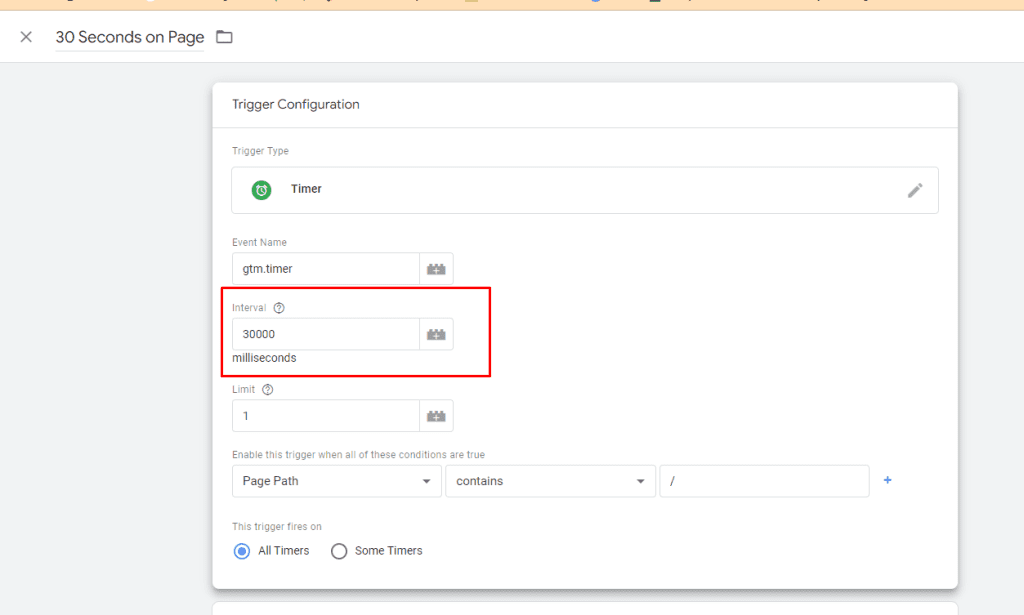
Create the third trigger, which is 30 seconds on the webpage. Repeat the same process as the previous step, but set the interval to 30000 milliseconds.
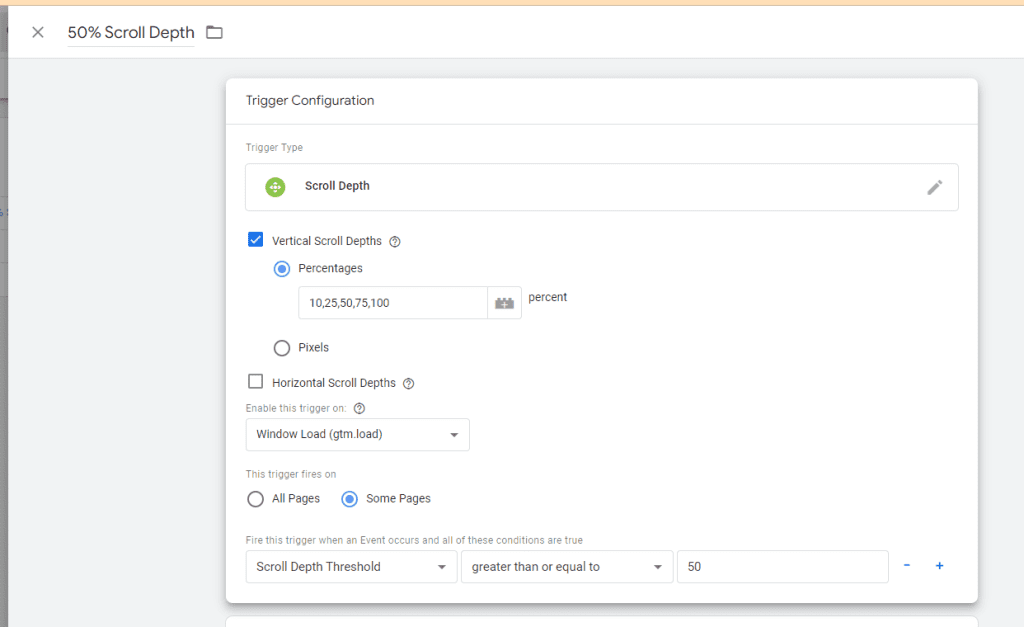
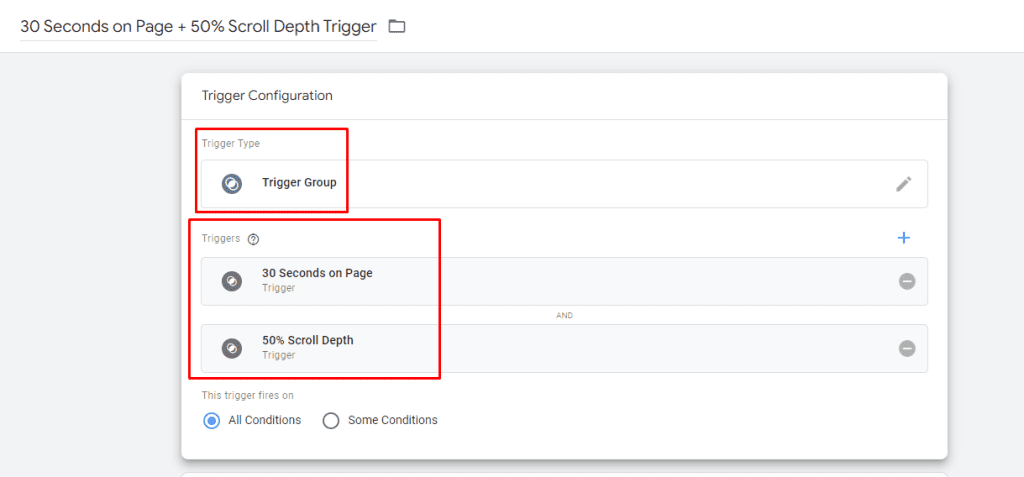
Create a 50% scroll depth trigger by clicking on “New” and selecting scroll depth as the trigger type. Tick on Vertical scroll depths and write 10, 25, 50, 75, and 100 as scroll percentages. On the trigger firing section, click on “Some pages” and “Fire this trigger when an Event occurs” If all of these conditions are true, select scroll depth threshold greater than or equal to 50 and click on save.
After creating these 3 triggers, create a trigger group which is 30 seconds on the page + 50% scroll depth trigger. This trigger will fire under all conditions.
Now that you have created the triggers, it’s time to set up the tags. Tags are snippets of code that send data to Facebook to track the events. Follow these steps to set up the tags:
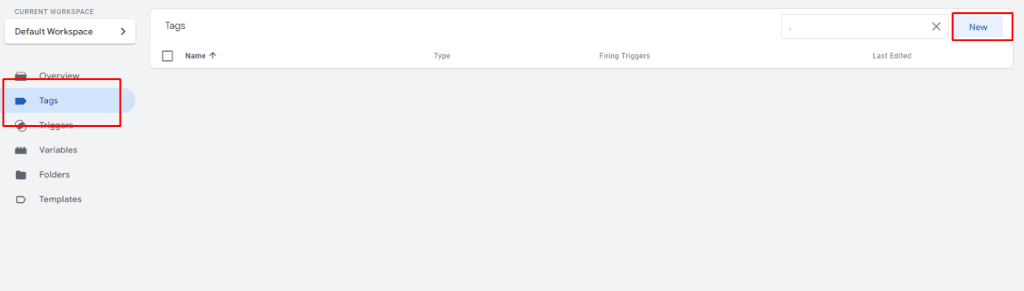
Go to the Tags section and click on “New.”
Create the first event tag, which will be attracted. Select the tag type as custom HTML and paste the code mentioned below. Choose the firing trigger as 5 seconds on the page.
<script>
  fbq('trackCustom','Attracted', {
    page: '{{Page Path}}'
  });
</script>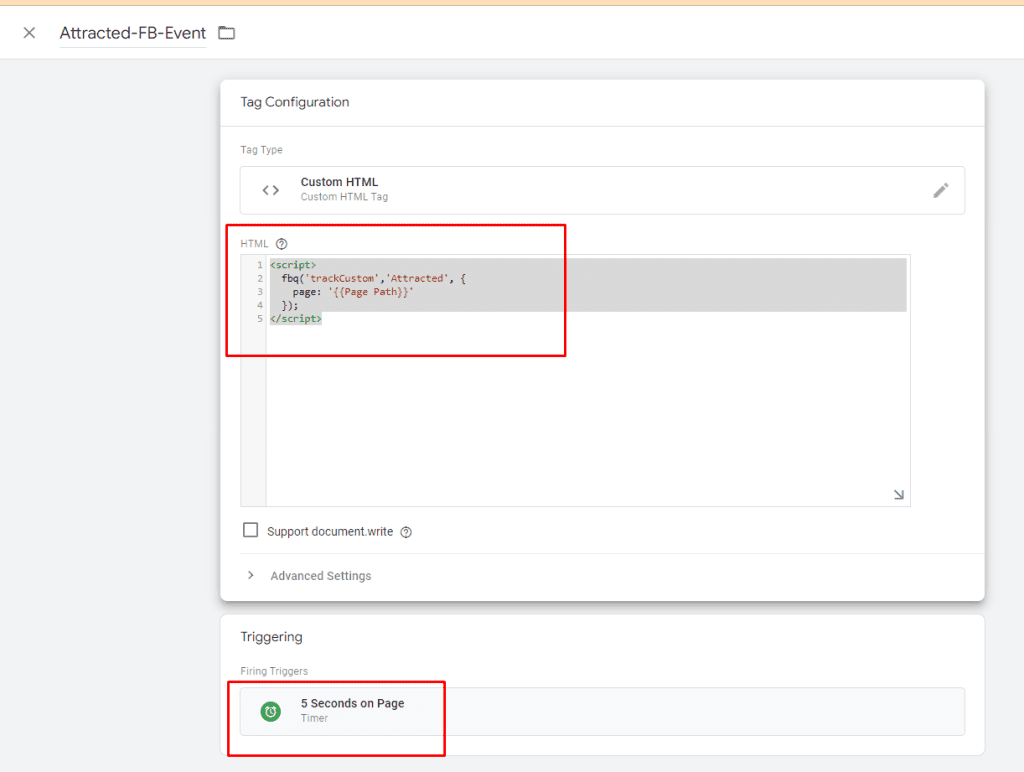
Create the second event tag, which is captivated. Select the tag type as custom HTML and paste the code mentioned below. Choose the firing trigger as 20 seconds on the page.
<script>
  fbq('trackCustom','captivated', {
    page: '{{Page Path}}'
  });
</script>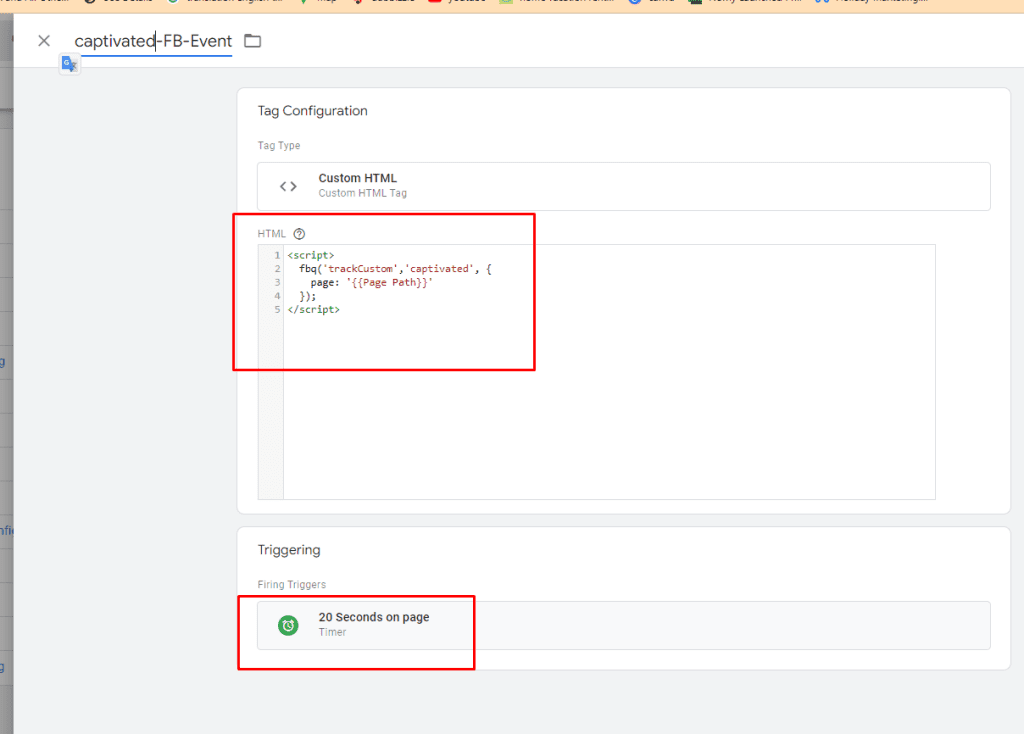
Create the third and last tag, which will be attached. Select the tag type as custom HTML and paste the code mentioned below. Choose the firing trigger as 30 seconds on the page + 50% scroll depth.
<script>
  fbq('trackCustom','Attached', {
    page: '{{Page Path}}'
  });
</script>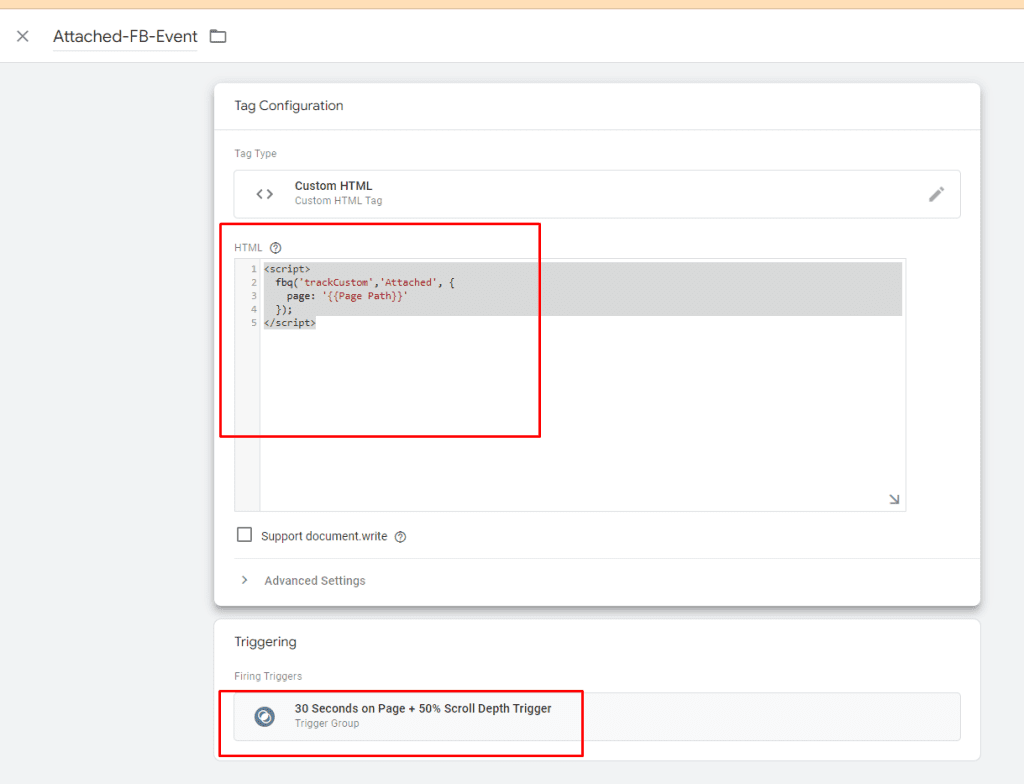
By setting up these custom events in GTM, you can track the actions of users on your website and use the custom metrics to analyze the data and make better decisions for your Facebook ad campaign.
Now its time to set up custom conversions step-by-step:
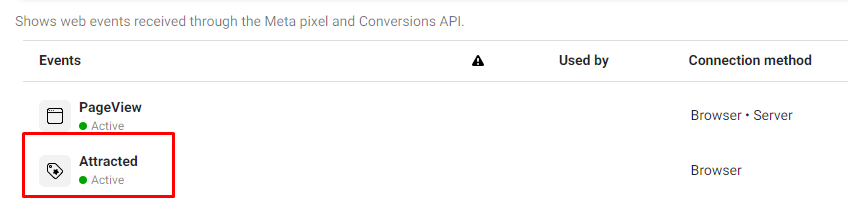
Wait for a few days after setting up the events in GTM for the pixel data to populate. Once you start receiving events on the custom events “Attractive”, “Captivated”, and “Attached”, proceed to the next step.
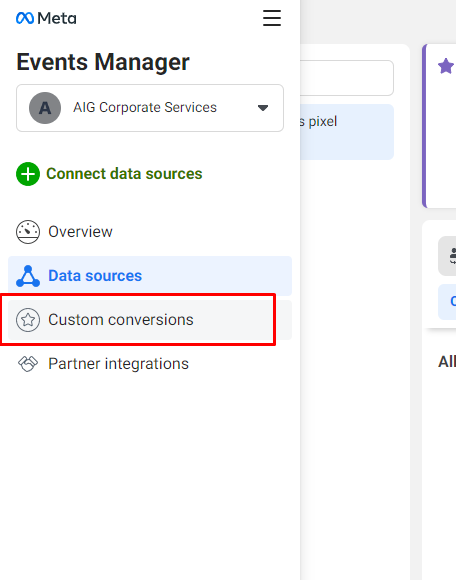
Go to your Facebook Event Manager in Business Suite.
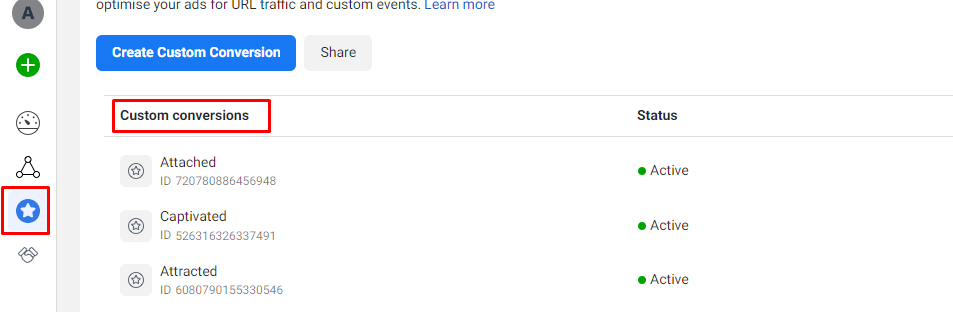
Click on “Custom Conversions” from the left-hand menu.
Click on “Create Custom Conversion”.
Name the first custom conversion “Attractive”. Select the right pixel and source and choose the event “Attractive”. In the “Rules” section, set the rule as URL contains “/”.
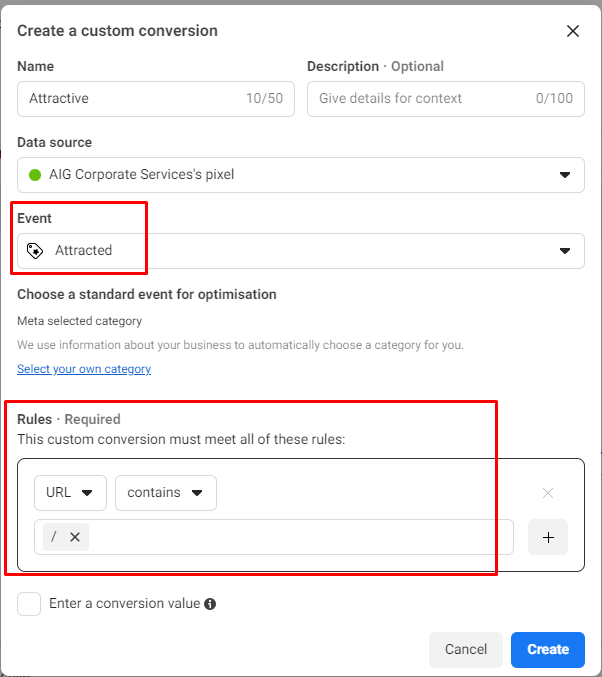
Repeat step 5 for the second and third custom conversion. For the second custom conversion, select the event “Captivated”, and for the third custom conversion, select the event “Attached”. The rule will be the same for all three custom conversions, which is URL contains “/”.
Now your three custom conversion events are successfully set up. These custom conversions will help you track the actions that lead to better results for your Facebook ads campaigns.
In the next section, I will explain how to create a report using these custom metrics and conversions to improve your decision-making and generate high-quality and cheaper results.
Creating Facebook Ads Report with Custom Metrics and Custom Events
To create a report on Facebook using the custom events and metrics, follow these steps:
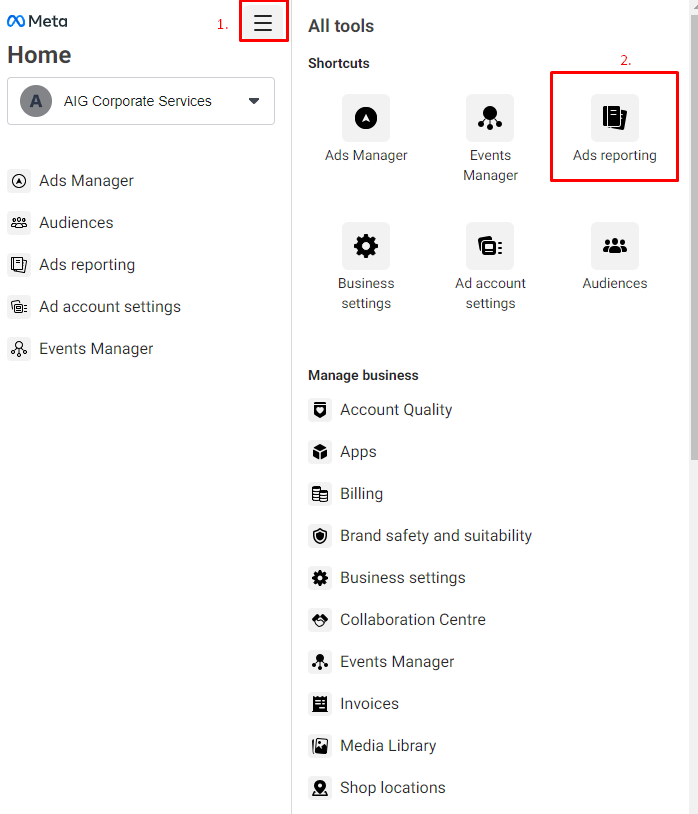
Go to https://business.facebook.com/home/ and click on “All tools” on the left side of the page, then click on “Ads Reporting.”
Click on “Create new” to create a new report. After that, unselect all metrics and dimensions so that the report looks blank.
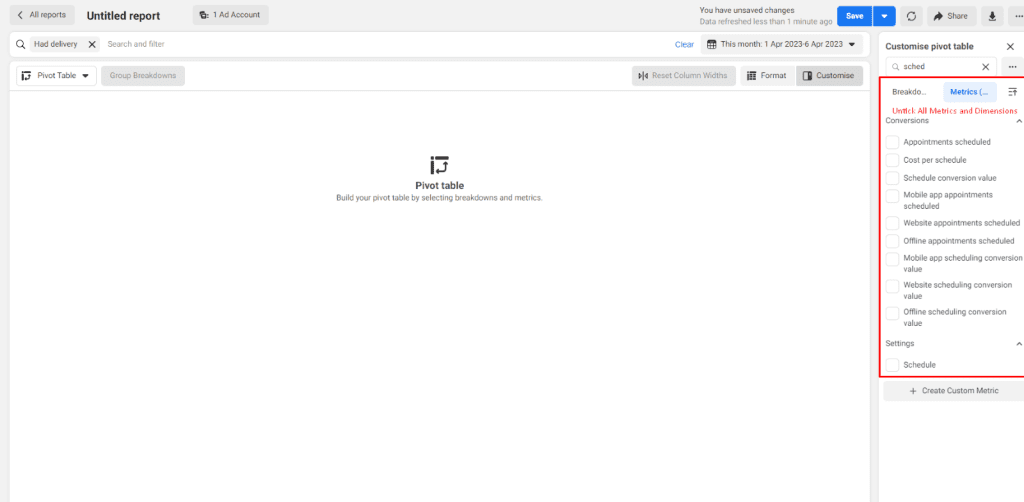
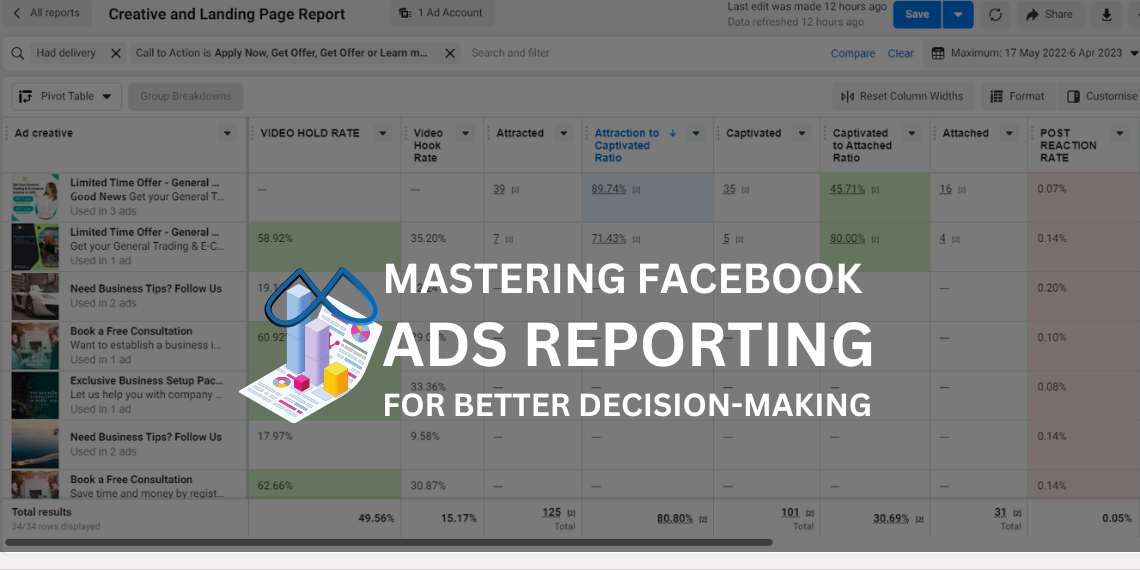
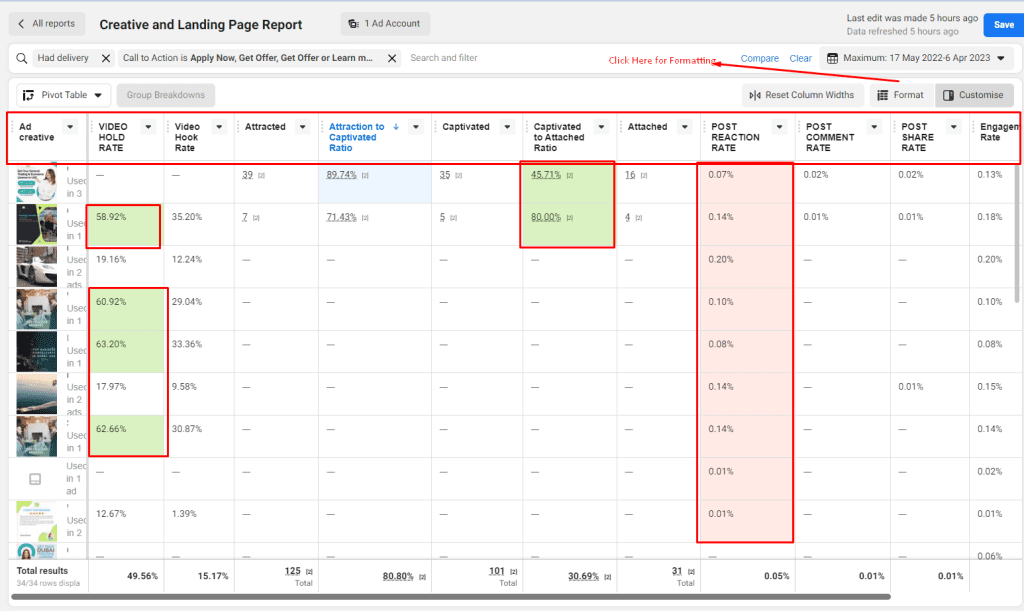
On the dimensions table, select “Ad creative” and on the metric table, select all custom metrics and custom conversions that were created earlier using GTM and formulas.
To add custom metrics, click on “Create a custom metric” and add the formulas that were mentioned earlier in the blog. Repeat the same process to add all custom metrics to the report.
After creating the report, you can analyze the data to better understand which video ads are gaining the attention of your audience and driving engagement with your business website.
Format your report accordingly to make it more visually appealing and easier to understand.
By using custom events and metrics, you can get a more detailed and accurate understanding of how your ads are performing and how they are affecting your business goals. This information can help you make more informed decisions about your ad campaigns and improve their overall effectiveness.
Conclusion
In conclusion, setting up custom events, custom metrics, and custom conversions in Facebook Event Manager and Google Tag Manager can provide valuable insights into the performance of your Facebook video ads. By tracking user behaviour and engagement, you can make data-driven decisions and optimize your advertising strategy accordingly. Creating custom reports using these metrics and conversions can provide a comprehensive view of your ad campaigns and help you measure success. With these tools at your disposal, you can gain a better understanding of your audience and improve your advertising efforts to drive better results.

Hello, I’m Ali Raza, the brain behind Digital Realm Trends.
Hailing from the vibrant world of digital marketing, I’ve honed my skills over years. Based on my experience, I’m here to unravel the complexities of digital marketing, analytics and paid marketing, crafted for individuals like you. Join me in uncovering the power of digital marketing tools and strategies, fueled by experimentation and insights.