Understanding the Facebook Ads Reporting
As a business owner or marketer, you want to make the most of your advertising budget and get the best return on investment (ROI) possible. Facebook Ads is one of the most popular advertising platforms, with over 2.8 billion monthly active users. To help you understand the performance of your Facebook Ads campaigns, the platform provides robust reporting features that allow you to measure the impact of your advertising efforts. In this beginner’s guide, we’ll explore the key components of Facebook Ads reporting and help you make sense of your campaign data.
Facebook Ads reporting tool provides detailed information about the performance of your ads, including impressions, clicks, conversions, and more. To access the reporting tool, log in to your Facebook Ads Manager and select the campaigns you want to view. From there, you’ll be able to see a summary of your campaign performance, including metrics like cost per click (CPC), cost per action (CPA), and return on ad spend (ROAS).
Key Metrics in Facebook Ads Reporting
Here are some of the key metrics that you’ll find in Facebook Ads reporting:
Impressions
Impressions refer to the number of times your ad has been displayed to users. This is an important metric to track as it gives you an idea of the reach of your ad and how many people have been exposed to it.
Clicks
Clicks refer to the number of times users have clicked on your ad. This metric is important because it shows you how many people are interested in your ad and are taking action to learn more about your business or product.
Conversion
Conversions refer to the number of times users have taken a desired action after clicking on your ad. This could be a purchase, sign-up, or any other action that you define as a goal for your campaign. Conversion rates are calculated by dividing the number of conversions by the number of clicks.
Cost per Click (CPC)
Cost per click (CPC) is the average cost you pay for each click on your ad. This metric is calculated by dividing the total cost of your campaign by the number of clicks.
Cost per Action (CPA)
Cost per action (CPA) is the average cost you pay for each conversion. This metric is calculated by dividing the total cost of your campaign by the number of conversions.
Understanding Facebook Advertising Report
In addition to the metrics mentioned above, Facebook Ads reporting also provides a detailed report on your advertising campaign. This report includes information on ad placements, demographics, and device usage. You can use this information to make informed decisions about your campaigns and to optimize your advertising strategy.
Ad Placements
Ad placements refer to the location where your ad is shown, such as Facebook, Instagram, or Audience Network. The ad placement report will show you where your ad is performing best and where you may need to adjust your strategy.
Demographics
Demographics information gives you an understanding of the age, gender, and location of the people who are engaging with your ad. This information is useful for refining your targeting strategy and making sure that your ad is reaching the right audience.
Device Usage
The device usage report shows you how people are engaging with your ad on different devices, such as desktop, mobile, or tablet. This information is important for optimizing your ad for different devices and ensuring that your ad is providing a good user experience.
Facebook Ads reporting provides valuable insights into the performance of your advertising campaigns. By understanding the key metrics and utilizing the reporting tools, you can make informed decisions to optimize your advertising strategy and improve your ROI.
Tips for Making the Most of Facebook Ads Reporting

Now that you have a good understanding of the Facebook Ads reporting tool, here are some tips for making the most of your data:
- Set clear goals for your campaigns. This will help you determine which metrics are most important for your business and focus your attention on the data that truly matters.
- Regularly review your campaign data. This will help you identify any trends or patterns in your performance and make changes to your strategy accordingly.
- Experiment with different targeting strategies. Try targeting different audiences, changing your ad placements, and testing different ad formats to see what resonates best with your target audience.
- Utilize A/B testing. Test different versions of your ad to see which one performs better and make data-driven decisions to optimize your campaigns.
- Make use of the Facebook Ads reporting tools. Take advantage of the various reports and analysis tools provided by Facebook Ads to gain deeper insights into your performance.
By following these tips, you can make the most of Facebook Ads reporting and improve your advertising results.
Facebook Ads Performance Report
Here’s a sample Facebook Ads report table to give you a visual understanding of the information you can expect to see in your Facebook Ads reporting dashboard:
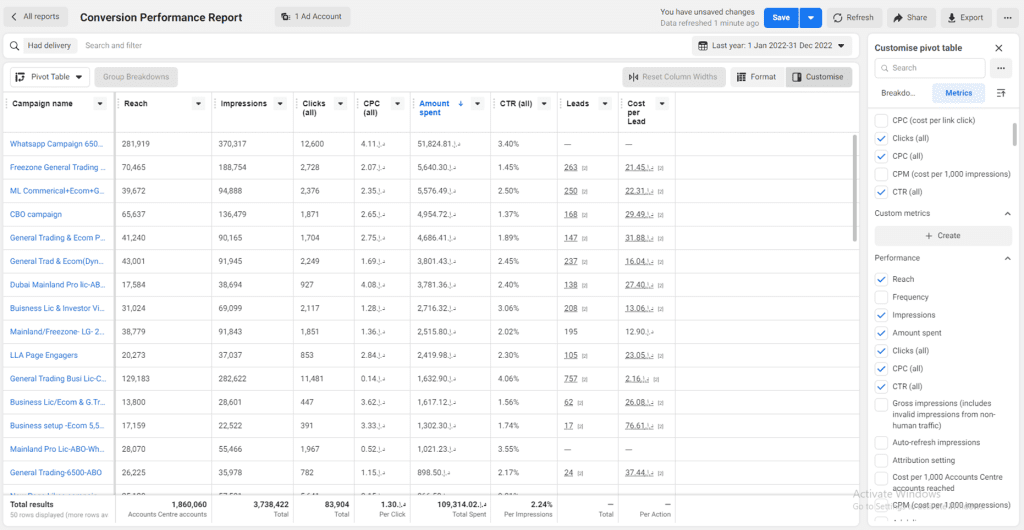
In this report, you can see the campaign name and the date range for which the data is being reported, as well as the key metrics such as impressions, clicks, CTR, conversions, leads, cost per click (CPC), cost per Lead, and Amount Spend. This sample report provides a high-level overview of your campaign performance, giving you an idea of how your ad is resonating with your target audience and what your return on investment is.
In addition to this high-level report, you can also access more detailed reports that provide deeper insights into your performance. These reports can help you make informed decisions about your campaigns and optimize your advertising strategy for better results.
Conclusion
In conclusion, Facebook Ads reporting is a powerful tool for measuring the performance of your advertising campaigns. By understanding the key metrics and utilizing the reporting tools, you can make informed decisions to optimize your advertising strategy and achieve your marketing goals. With this beginner’s guide to Facebook Ads reporting, you’ll be well on your way to making sense of your campaign data and driving results for your business.

Hello, I’m Ali Raza, the brain behind Digital Realm Trends.
Hailing from the vibrant world of digital marketing, I’ve honed my skills over years. Based on my experience, I’m here to unravel the complexities of digital marketing, analytics and paid marketing, crafted for individuals like you. Join me in uncovering the power of digital marketing tools and strategies, fueled by experimentation and insights.